Schematic design
Conceptual design covering fact and dimension entities aligned to trip events, kiosks, vehicles, and subscriptions.
Project overview
This project implements an ETL pipeline to process historical bike sharing data from Austin (2013–present). The goal is to enable stakeholders to make informed decisions on bike usage patterns, station performance, demand distribution, and vehicle/subscription trends.
The pipeline extracts raw trip data, transforms it to calculate useful metrics (e.g., trips per kiosk, trips per hour, top stations, subscription and bike type analysis), and loads the results into a format suitable for visualization and analysis.
Source datasets are publicly available:
Austin MetroBike Trips
Austin MetroBike Kiosk Locations
Stakeholder requirements
Proposed data warehouse
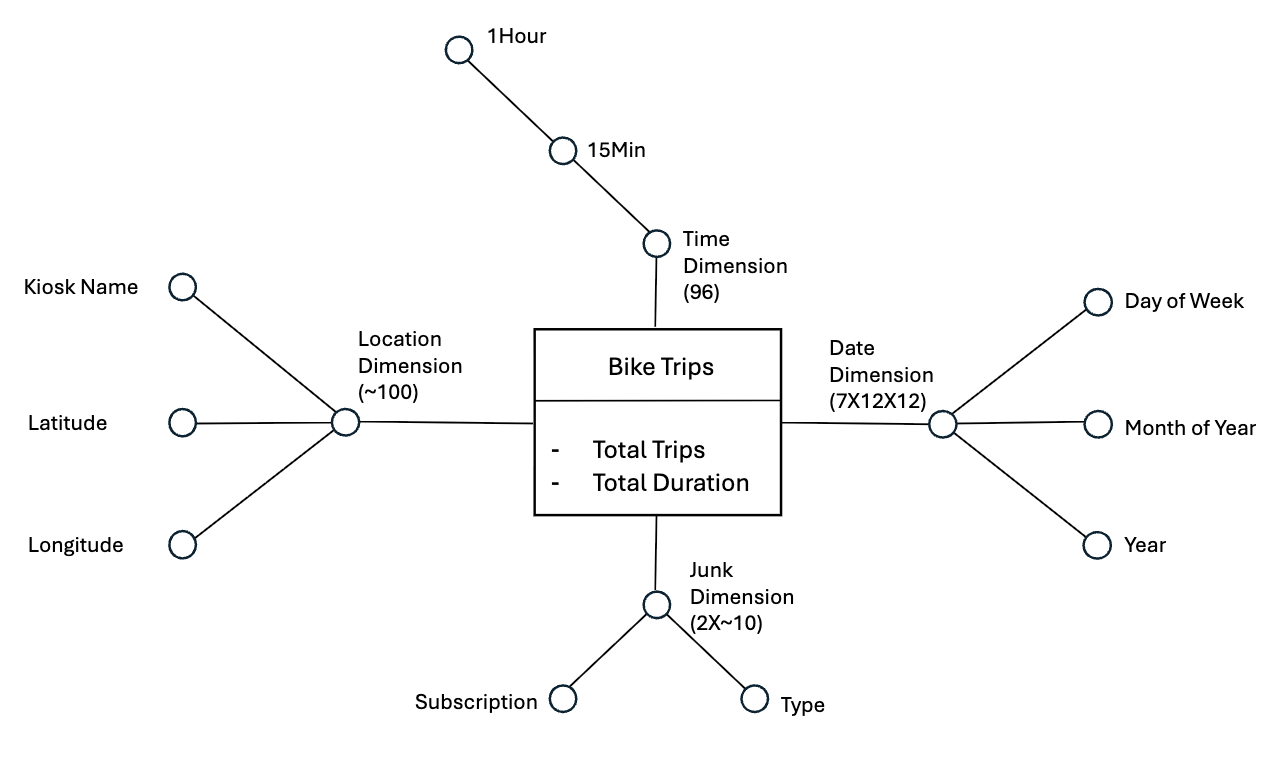
Schematic design
Conceptual design covering fact and dimension entities aligned to trip events, kiosks, vehicles, and subscriptions.
Logical design
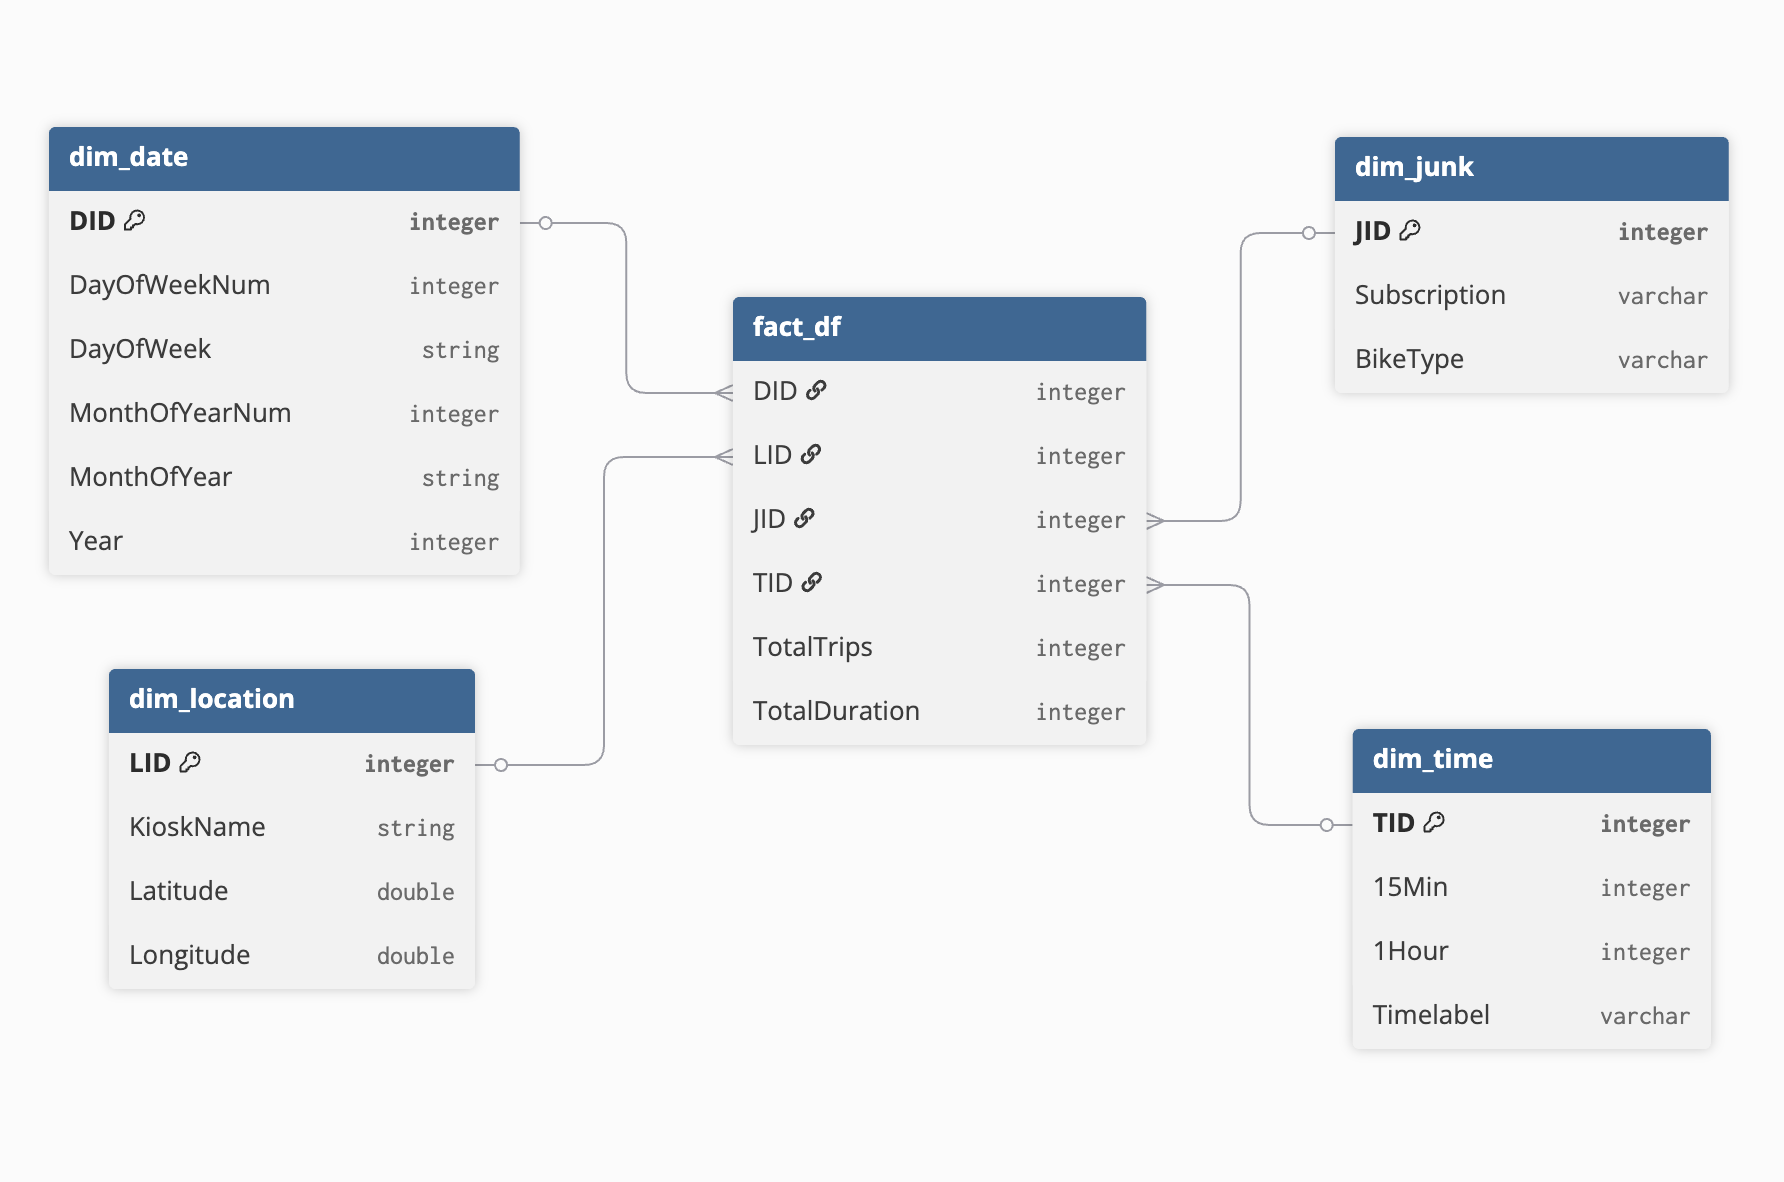
Logical schema drawn in DBDiagram to guide implementation and enforce relational integrity.
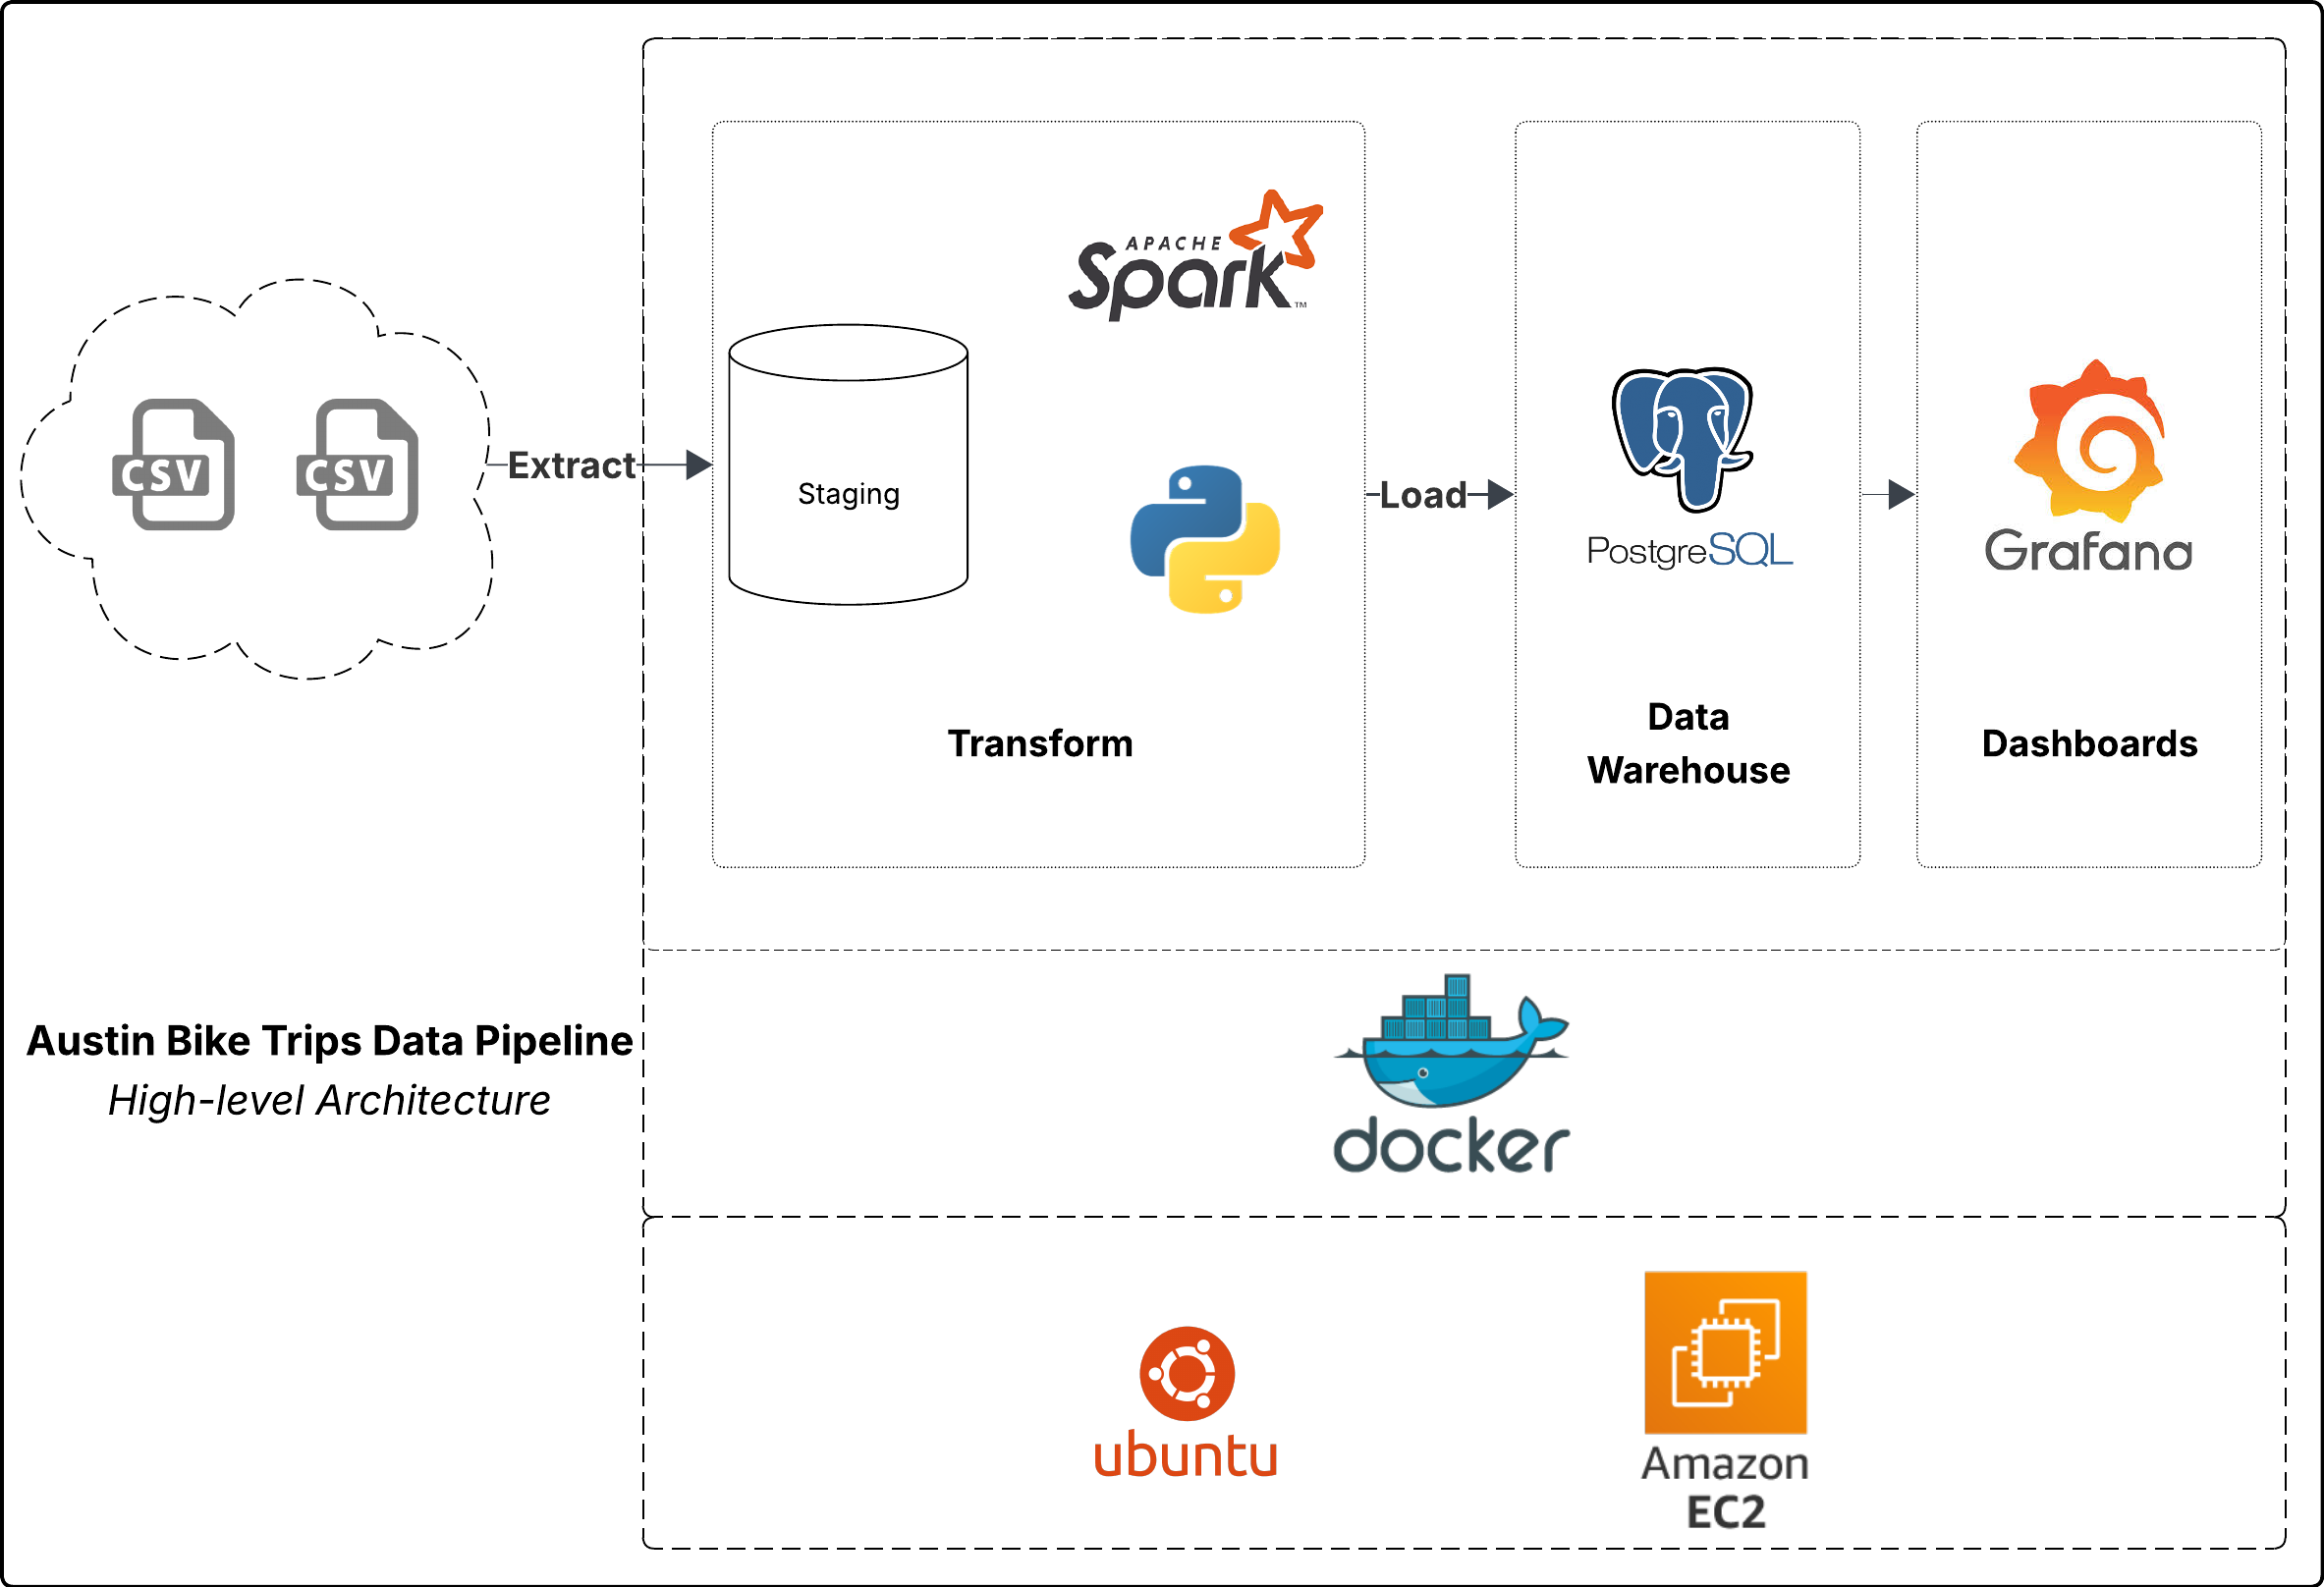
Project architecture
Below is a high-level architecture of the ETL pipeline. It highlights the operational flow from raw data pull to dashboards teams use every day.
Ready to explore
Together we can compose pipelines, metrics, and dashboards that make your operations faster, clearer, and more confident.