Open Austin Trips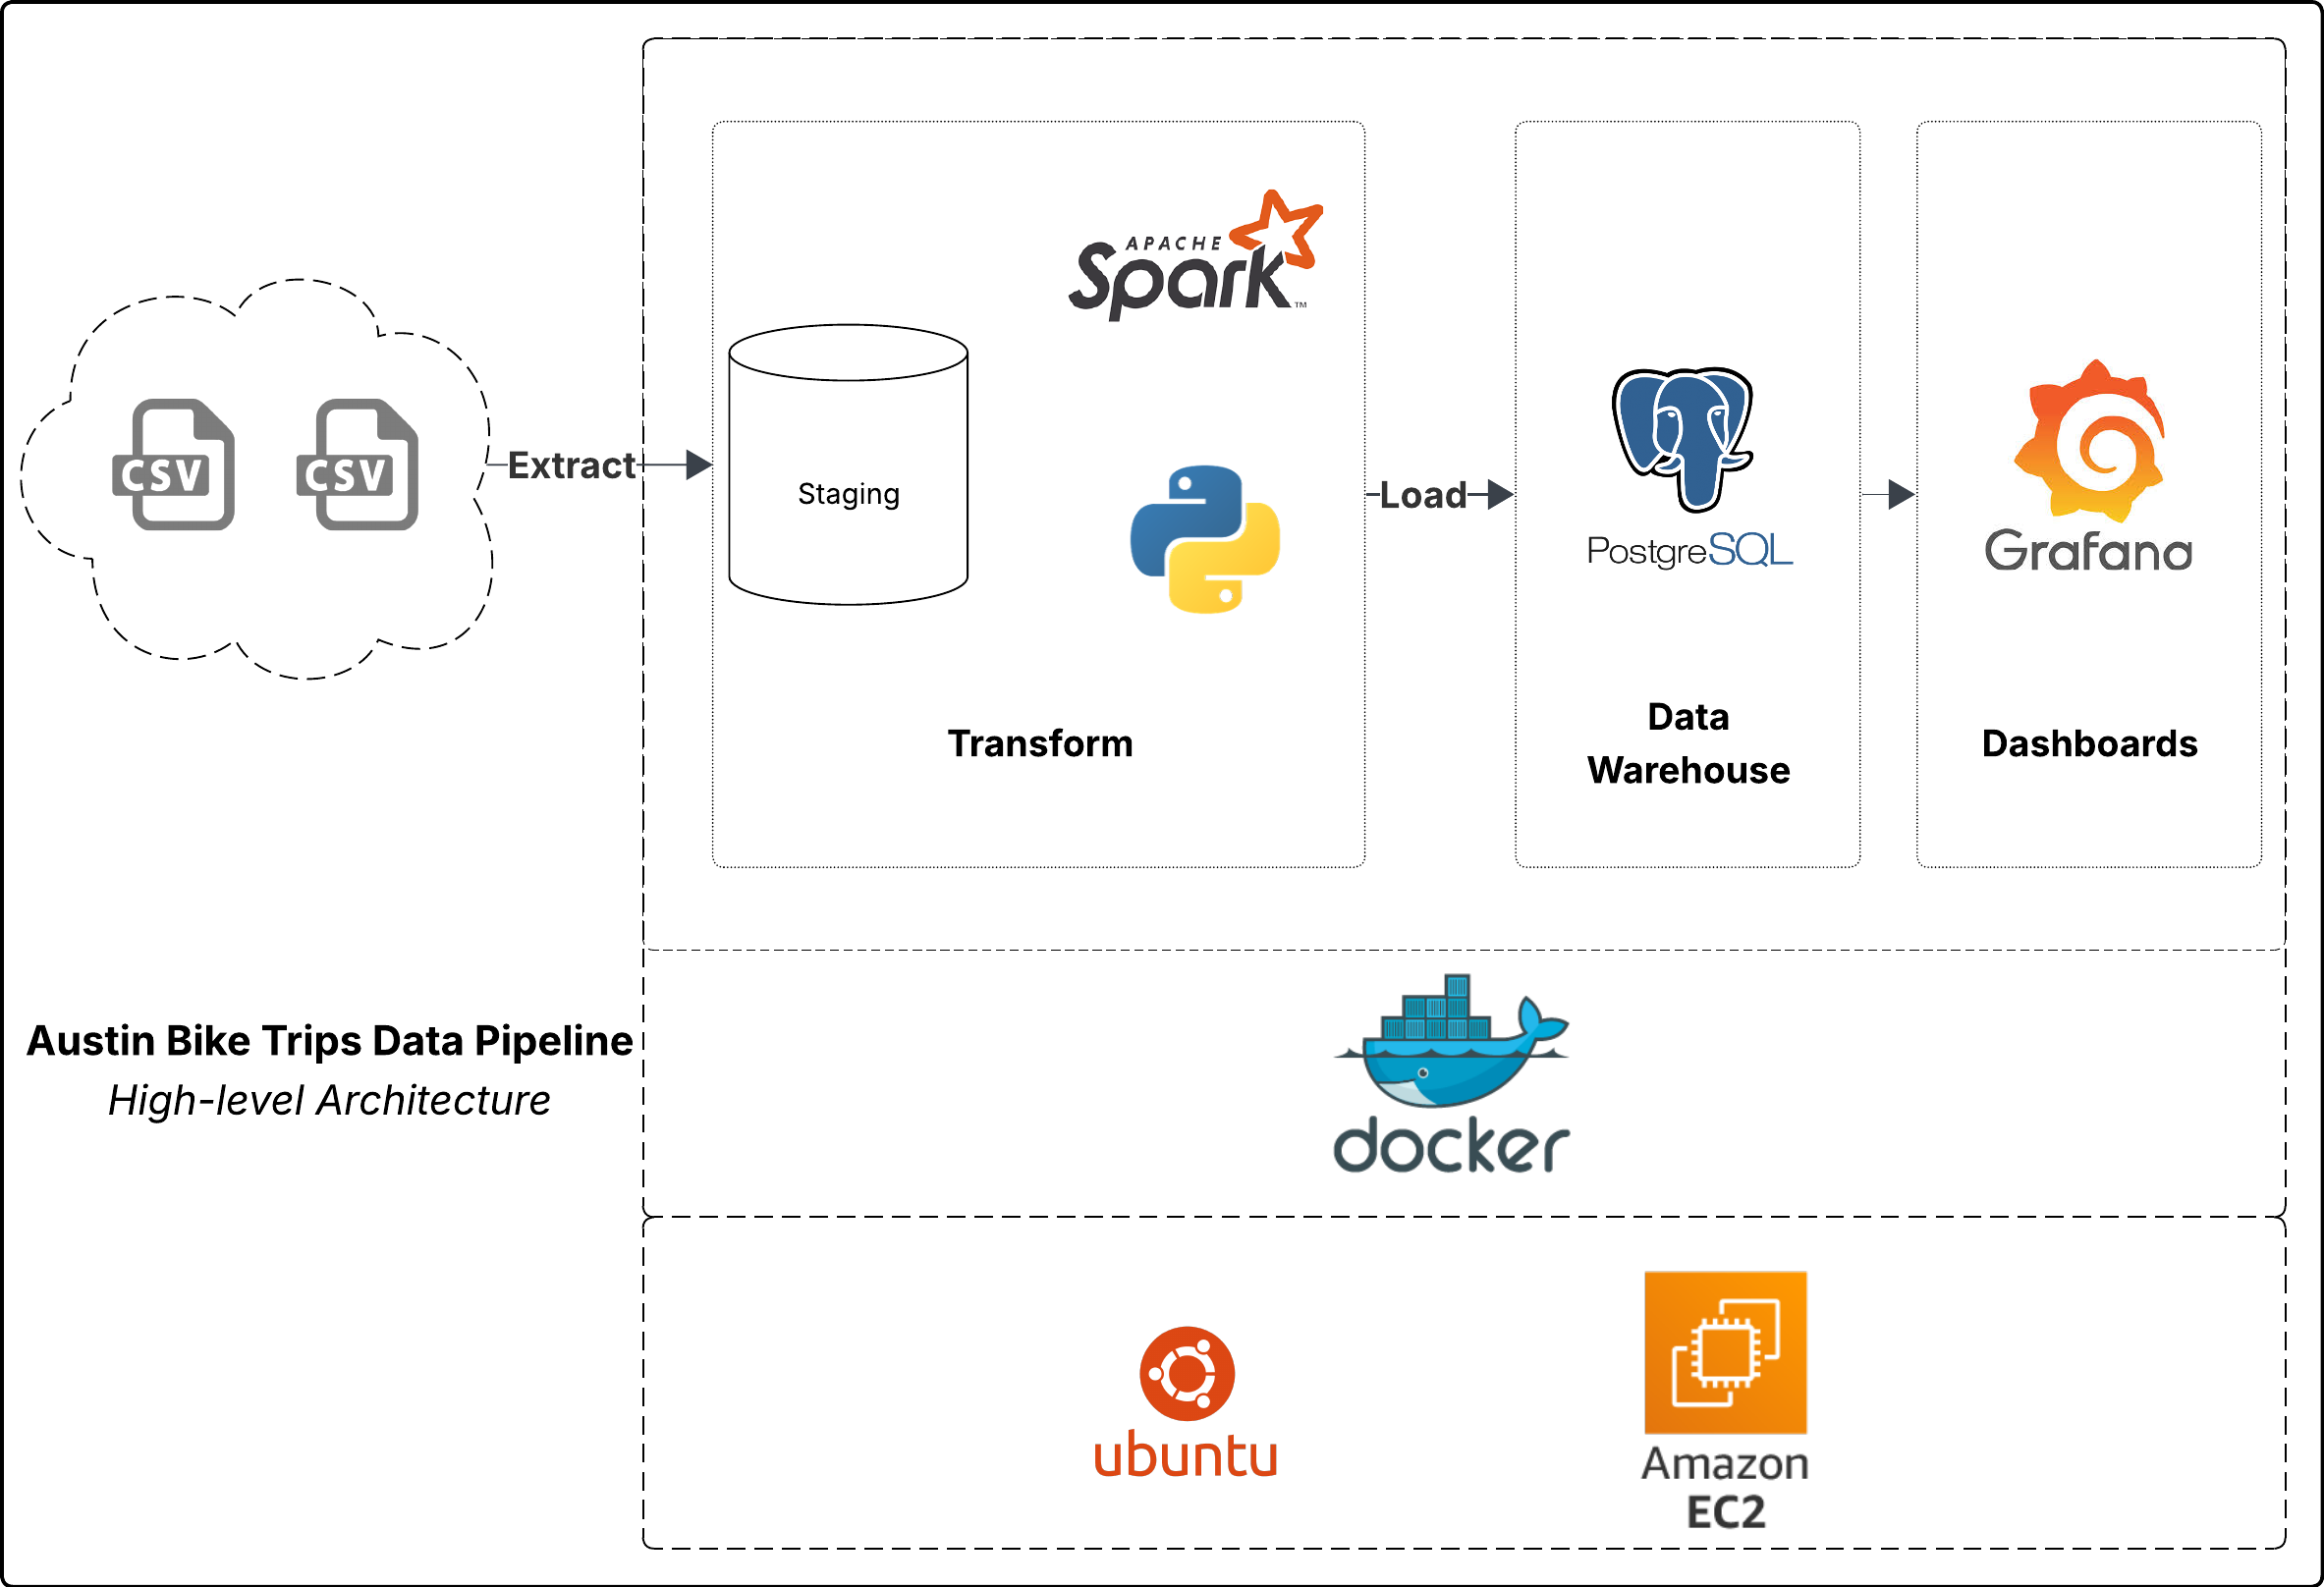
This project implements an ETL pipeline to process historical bike sharing data from Austin (2013–present). The goal is to enable stakeholders to make informed decisions on bike usage patterns, station performance, demand distribution, and vehicle/subscription trends. The pipeline extracts raw trip data, transforms it to calculate useful metrics (e.g., trips per kiosk, trips per hour, top stations, subscription and bike type analysis), and loads the results into a format suitable for visualization and analysis.
Personal Project2025
Austin Trips
This project implements an ETL pipeline to process historical bike sharing data from Austin (2013–present). The goal is to enable stakeholders to make informed decisions on bike usage patterns, station performance, demand distribution, and vehicle/subscription trends. The pipeline extracts raw trip data, transforms it to calculate useful metrics (e.g., trips per kiosk, trips per hour, top stations, subscription and bike type analysis), and loads the results into a format suitable for visualization and analysis.