2026Master's Thesis Project

Design of a Containerized Dashboard Platform and AI-Assisted Data Enrichment for Student Career Monitoring

Master’s Degree in Digital Skills for Sustainable Societal Transitions — Politecnico di Torino (DAUIN Department)

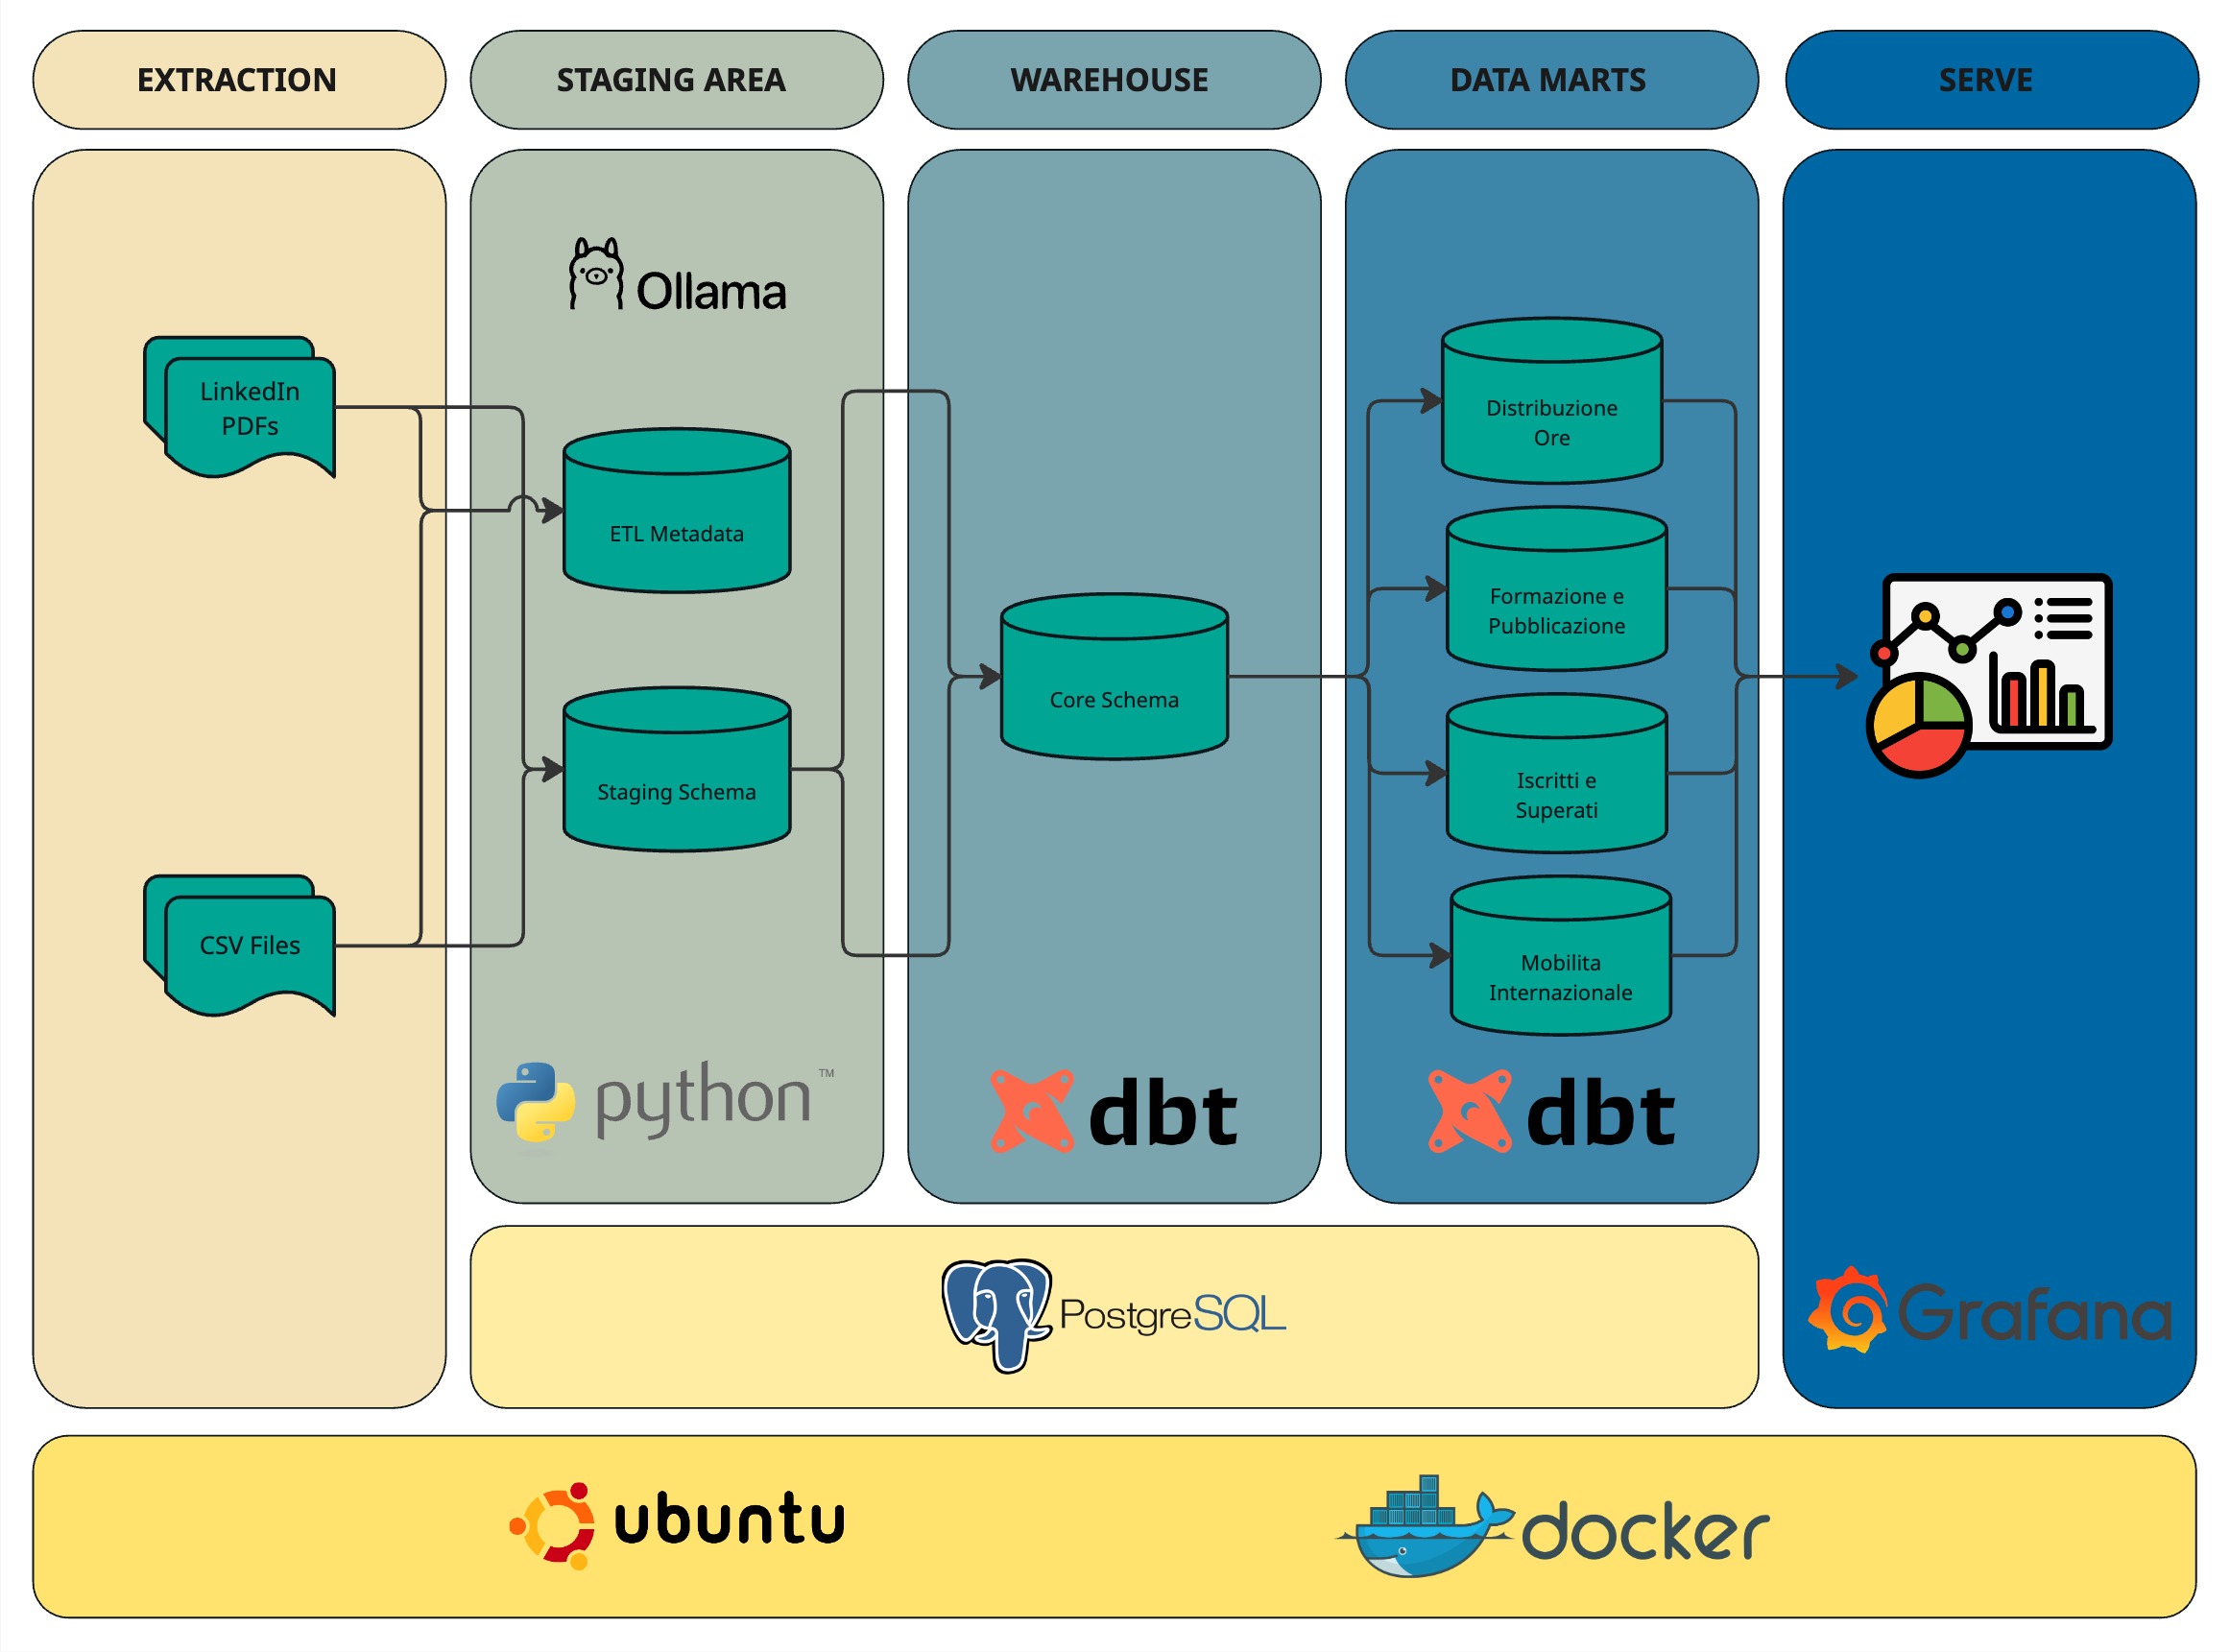
A fully containerized stack that ingests, transforms, enriches, and visualizes academic data to support data-driven monitoring of PhD student careers.

etl/eltdata viz

Objective

Enable structured, repeatable, and transparent analysis of PhD students’ academic careers to support departmental decision-making.

Key Questions Answered

  • Academic and professional activities over time
  • Research output and publication trends per PhD cycle
  • Participation in international mobility programs and their durations
  • Collaboration patterns across activities and academic years
  • Supervisors’ publication activity
  • Core information about departmental courses

Data Sources

Structured CSVs and unstructured PDFs are curated, validated, and enriched before entering the warehouse.

CSV files

Structured academic datasets (activities, courses, mobility).

PDF files

Unstructured sources enriched via AI-assisted extraction to normalize key fields.

Architecture

PhD Studenti ETL & Dashboards architecture overview

Extraction Layer

  • Python ingestion of CSV and PDF sources
  • Early parsing and schema validation

Staging Layer

  • Python services populate staging schema
  • Ollama enriches unstructured data (AI-assisted extraction)
  • Cleaning, normalization, and schema alignment

Data Warehouse Layer

  • dbt builds the core schema
  • Business logic produces analytics-ready tables

Data Mart Layer

  • dbt publishes marts optimized for dashboards
  • Organized by analytical domain

Data Serving Layer

  • Grafana dashboards with filters for cycle, year, course, and mobility duration

Storage Layer

  • PostgreSQL underpins staging, warehouse, and mart schemas

Containerization & Execution Model

  • All services run in Docker (Ubuntu-based images)
  • Version-controlled for reproducible builds
  • Designed for annual runs with curated source files following the documented formats

Dashboards

Example Grafana dashboards produced by the platform with filters for cycles, years, courses, and mobility durations.

Dashboard showing formation hours across PhD cycles and academic years.

Academic & Training Hours

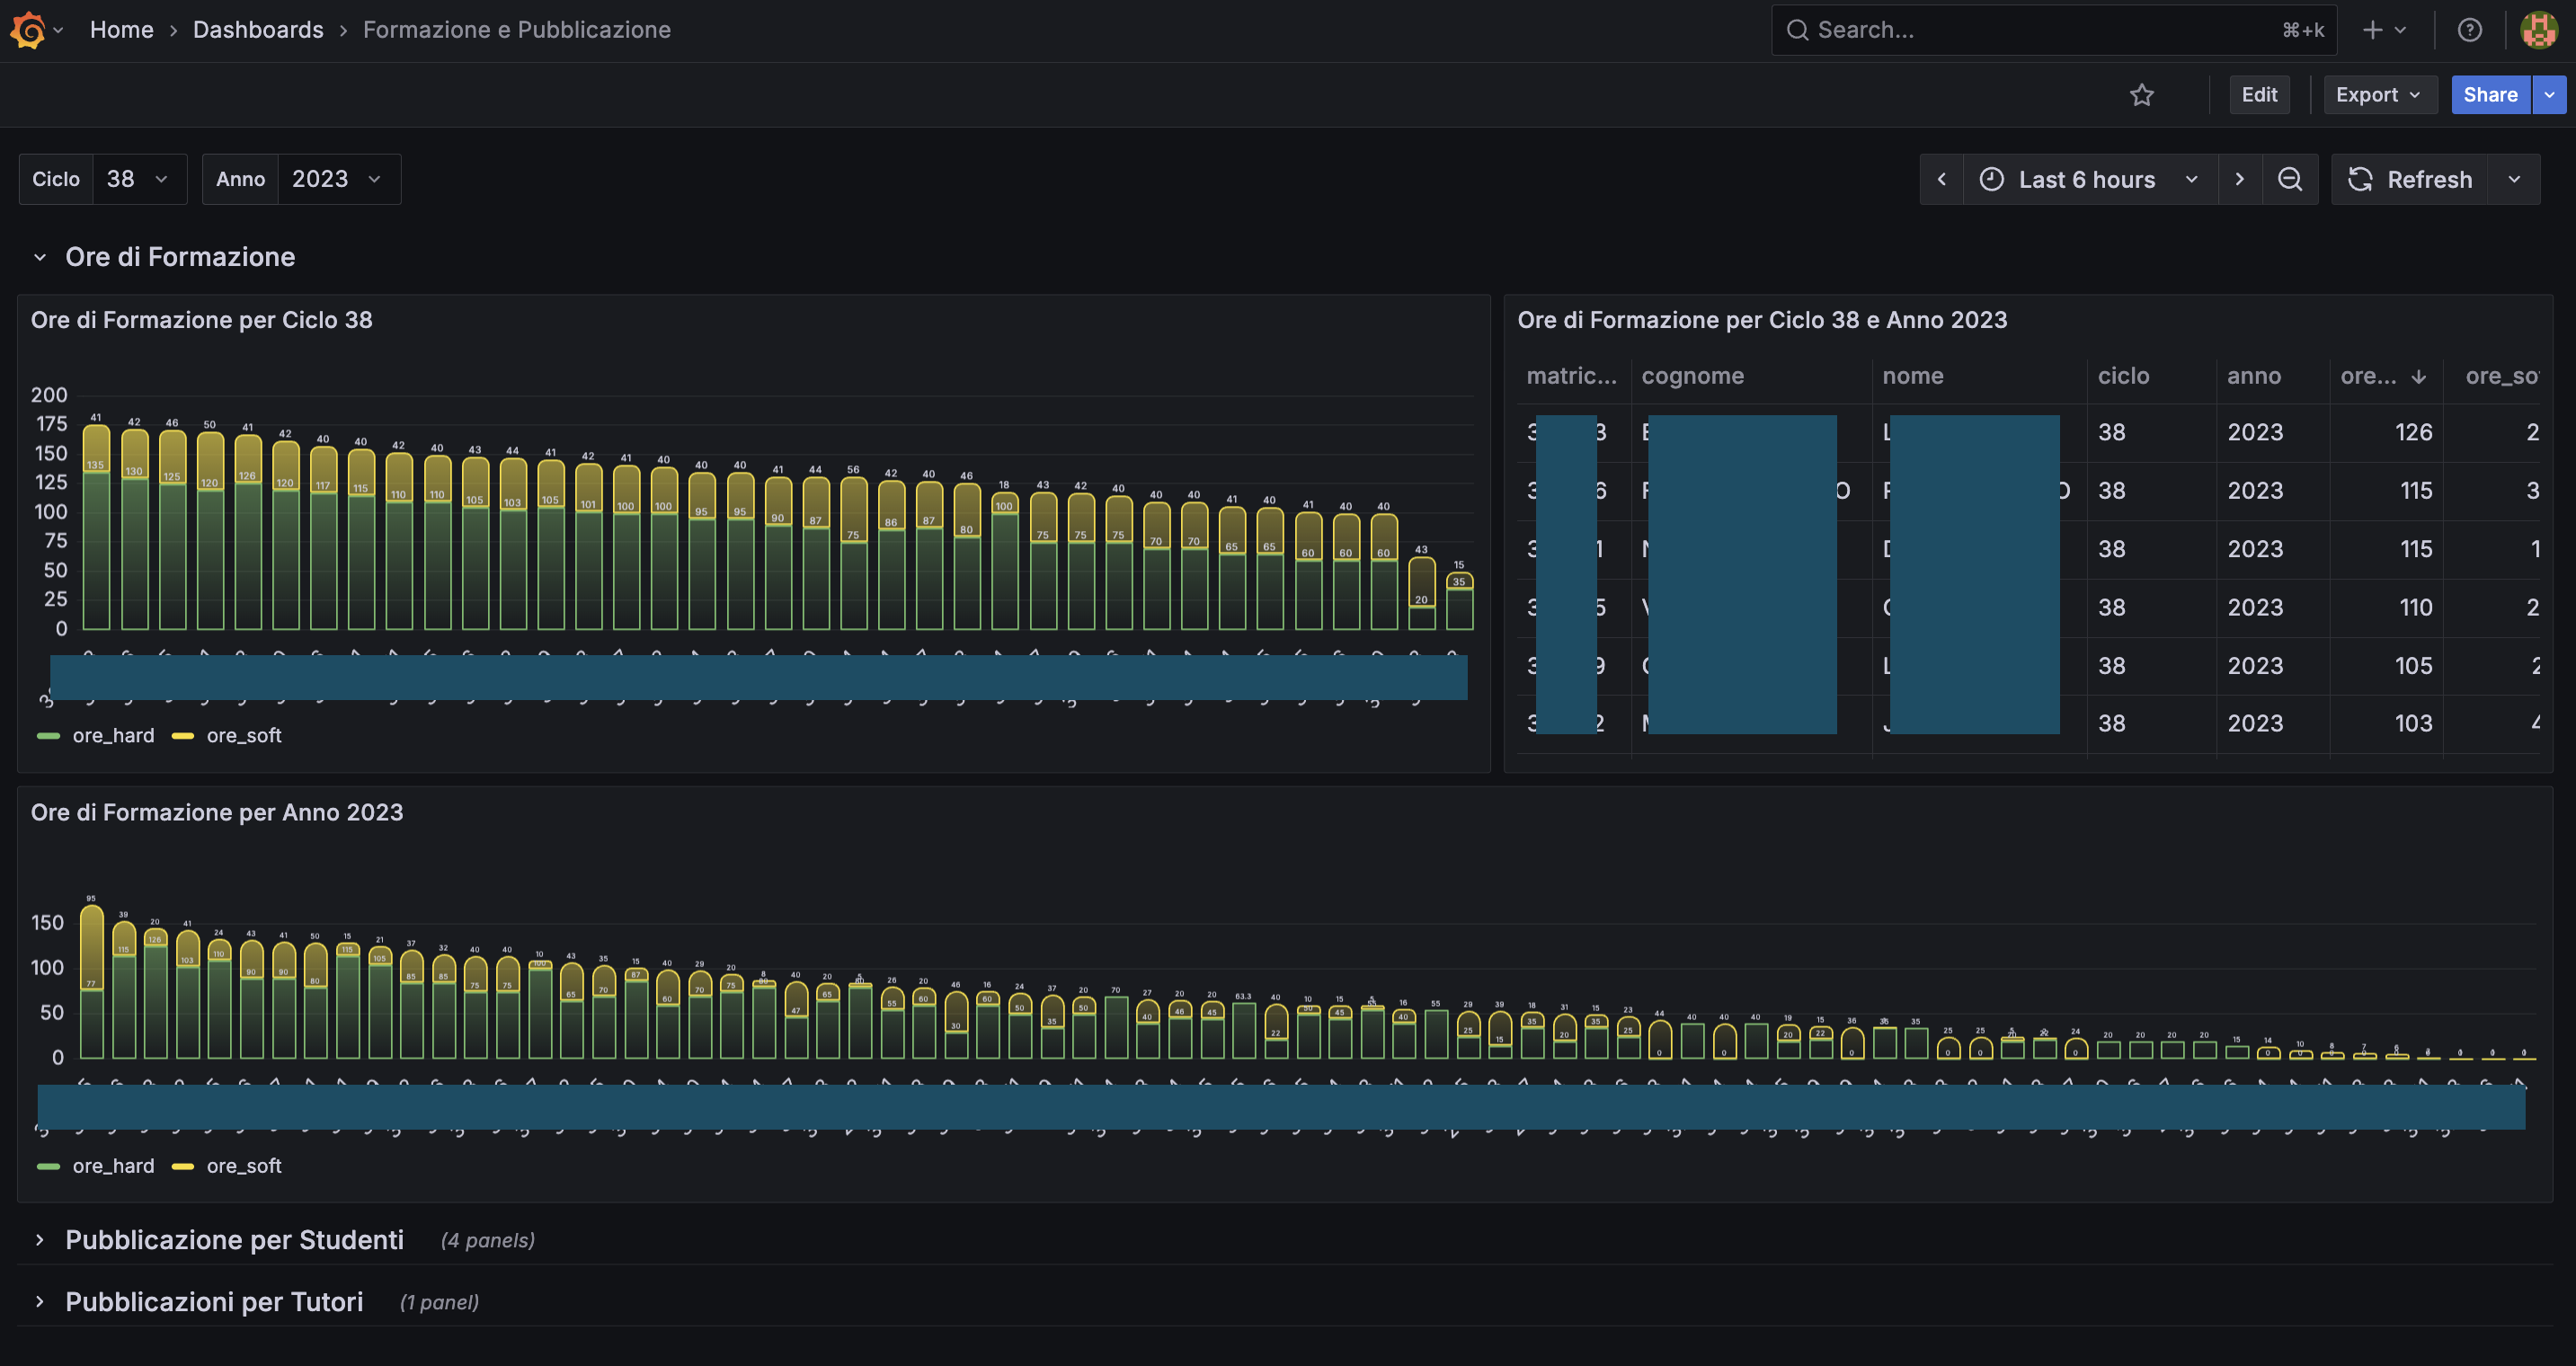
Formation hours across PhD cycles and years with filters for cohort and course groupings.

Dashboard summarizing international mobility participation and duration.

International Mobility

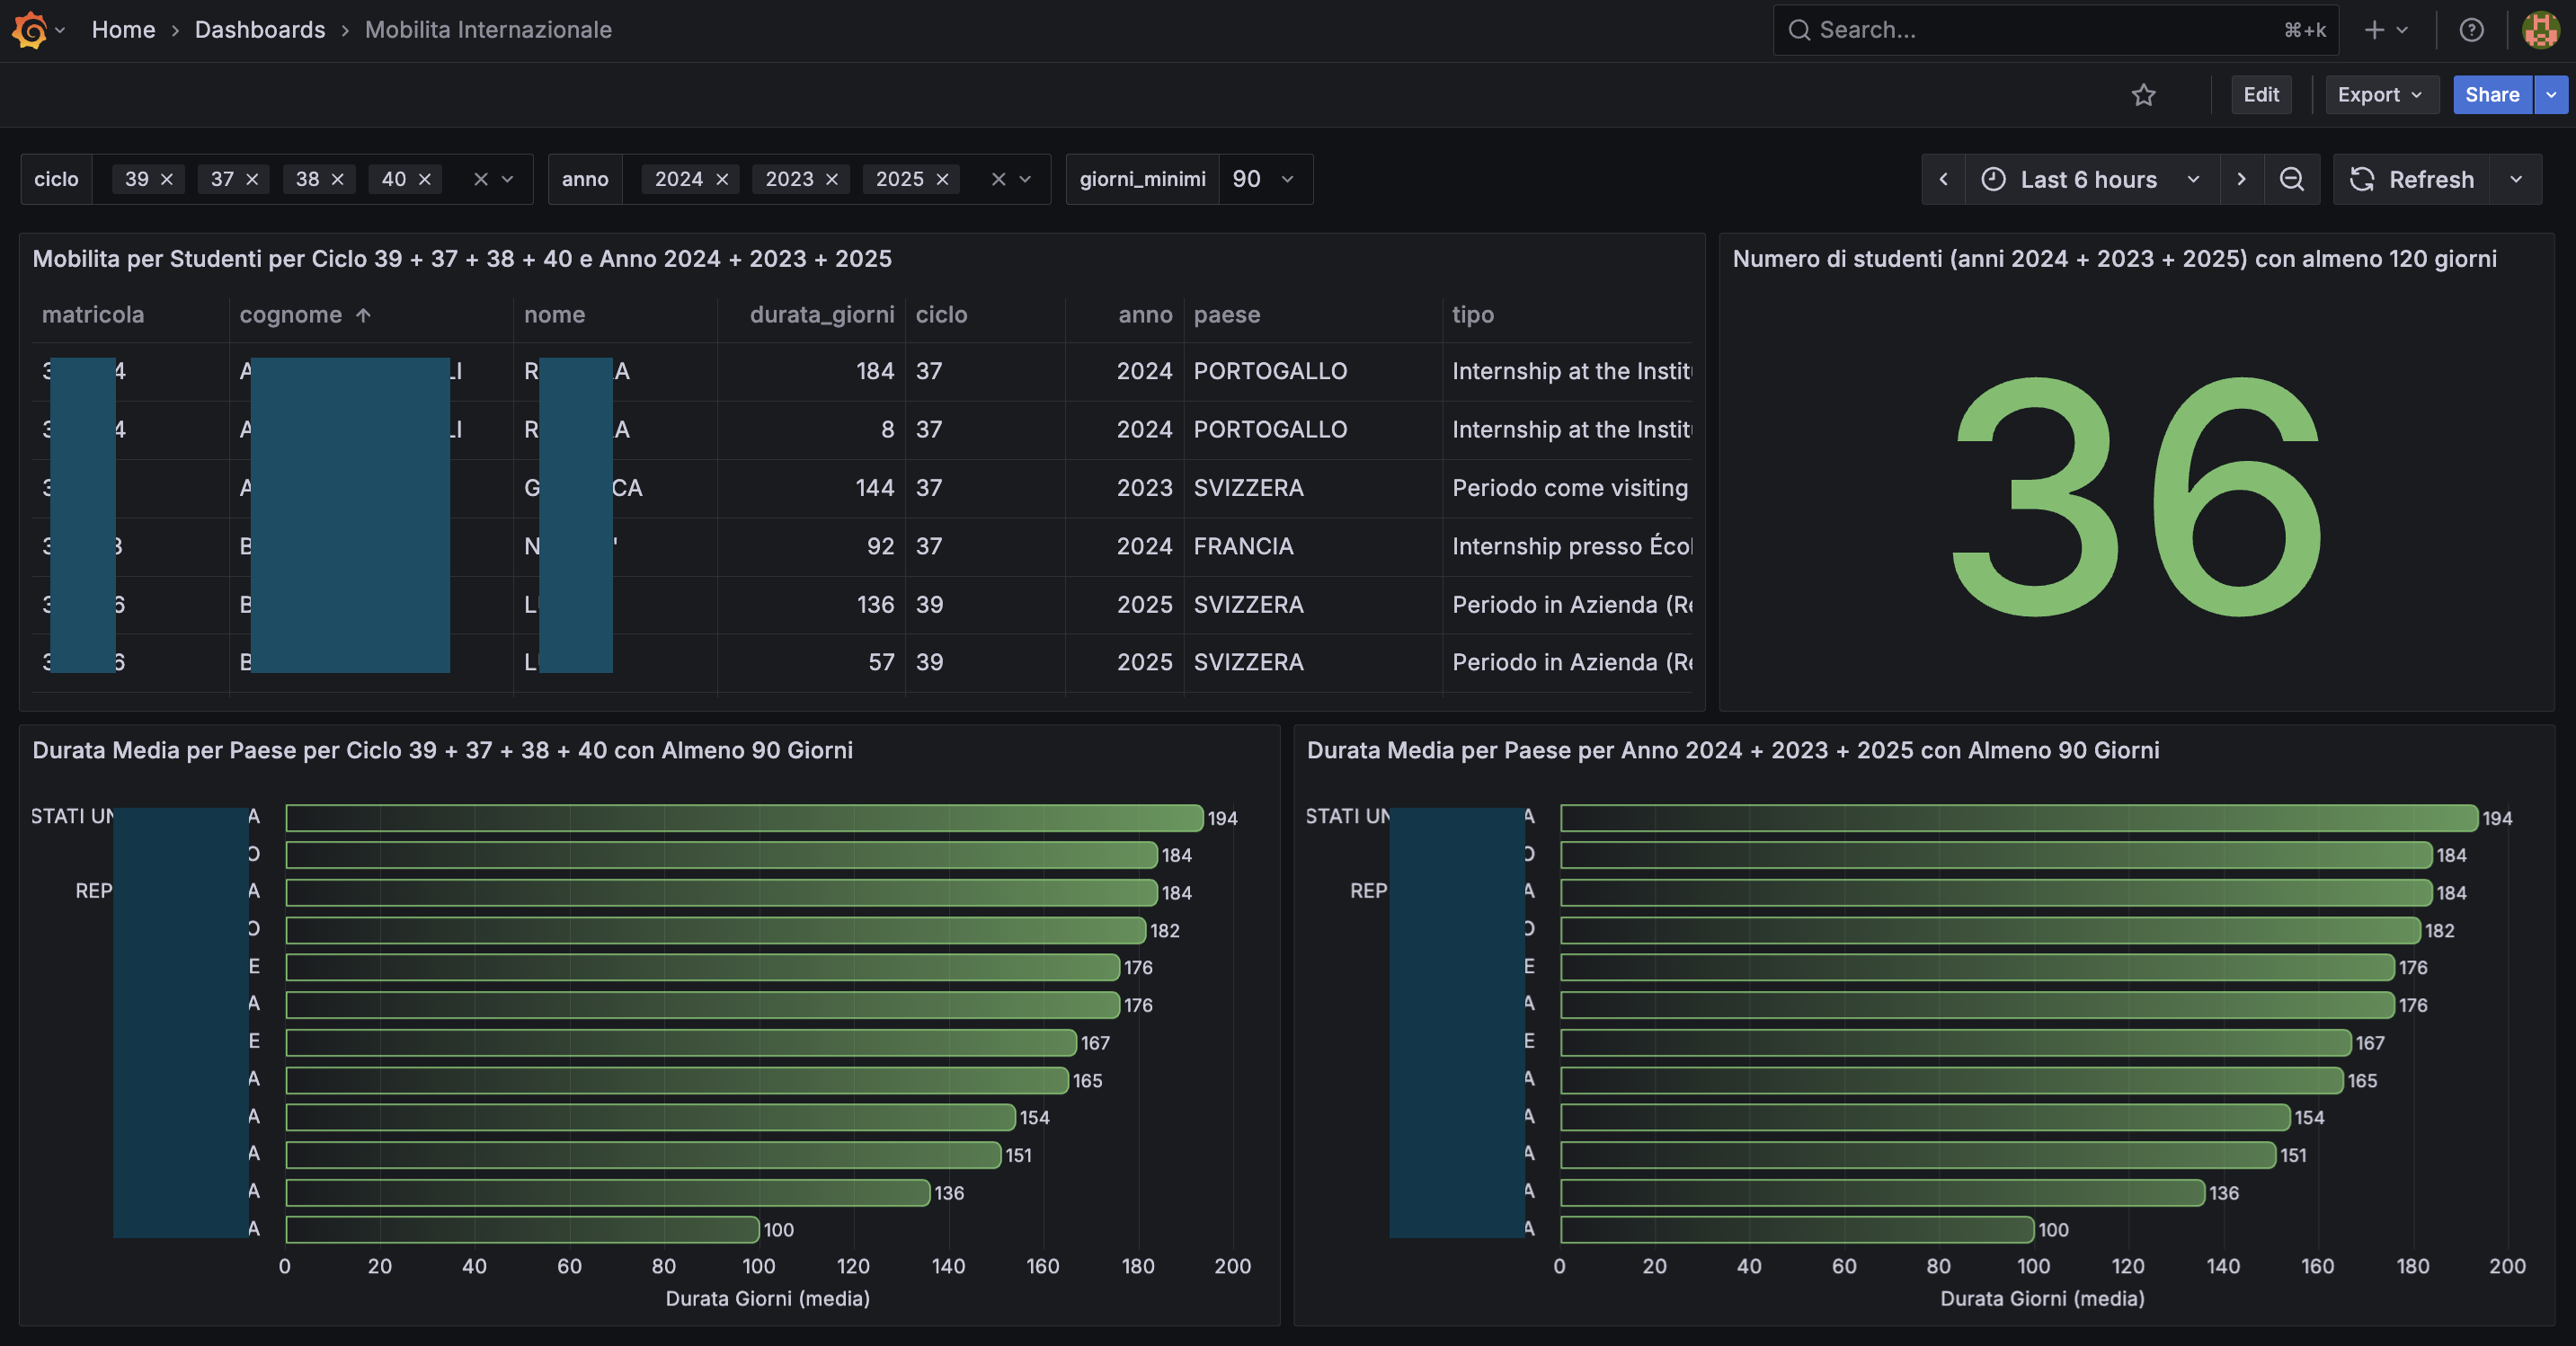
Participation and duration of international mobility programs segmented by cycle and year.

Source code and case study links for deeper exploration.